Graphs as a Framework for Design and Decision
Autodesk Research exists to de-risk emerging opportunities and unlock potential for the people who design and make the world around us. True to that mission the Net Zero Buildings (NZB) research team has spent the past year pursuing two complementary design challenges that now converge in a single exhibit at AU 2025. The Existing Buildings group, in partnership with Stanford University, has developed an AI-driven workflow that can see inside existing walls, inventory the concealed layers of materials and assemblies, and capture that information as machine-readable data, known as Knowledge Graphs. Find their AU talk on “Seeing Inside Walls: Using AI to Extend Scan-to-BIM for Material Circularity.”
The Low Carbon Materials group has created a material selection and recommender engine that combines live product and sustainability data to help architects make better informed decisions around lower-carbon options during early conceptual design. Although the two investigations tackle seemingly independent challenges, their findings speak the same language. Knowledge Graphs generated from the Stanford collaboration can flow directly into the material selection tool, creating a continuous loop that can describe what a building contains today and suggests what it could contain tomorrow. The result is a unified platform that helps AECO professionals plan circular retrofits, cut embodied carbon and uncover new economic value.
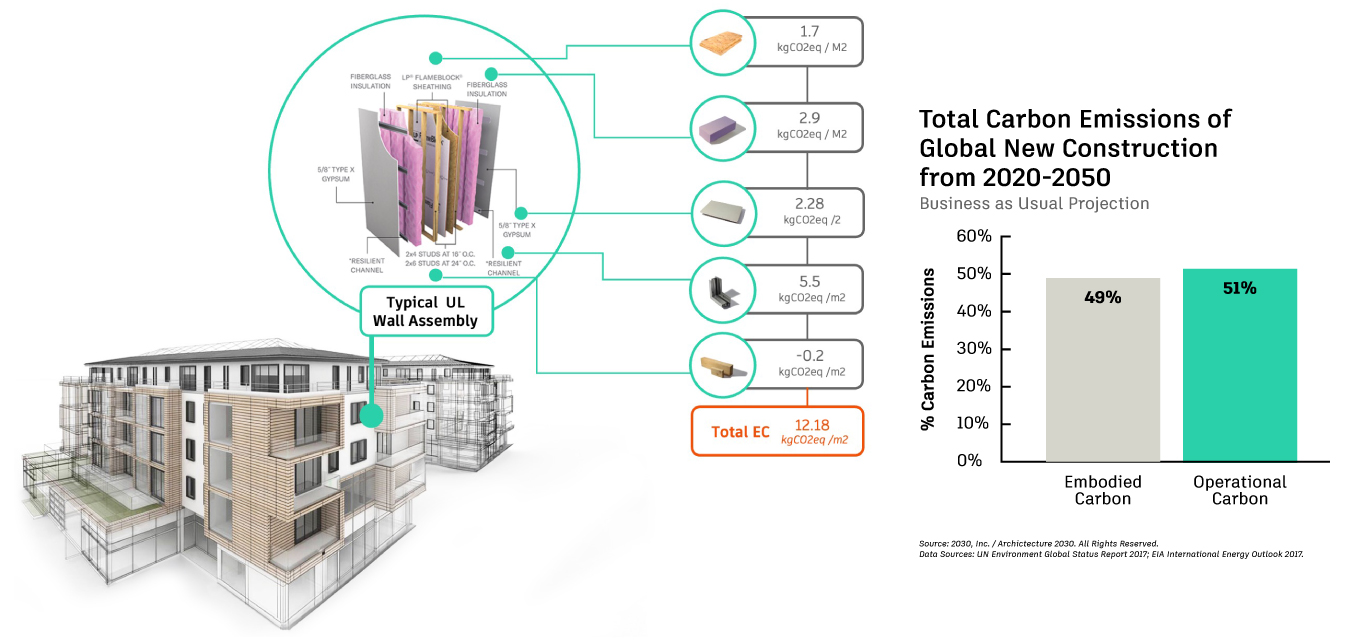
Figure 1 Embodied carbon in a typical wall assembly adds up quickly and, on a global scale, the materials used to build new construction could account for nearly half of all building-related carbon emissions between 2020 and 2050
By letting data behave as a design tool, the work advances CTO’s Raji Arasu’s vision for an open and flexible Autodesk Platform that delivers insight exactly when it is needed. This blog post takes a closer look at one everyday building feature, the wall assembly, to show how that platform thinking moves from research to real-world impact. Walls may appear simple, yet their construction has grown more complex in response to codes, performance targets, and climate goals. Understanding what they are made of and how they will perform across a full life cycle is essential for anyone trying to achieve net zero targets, and it is here that Knowledge Graphs reveal their power.
Materials are the key to Sustainability
The NZB Team has been exploring a deceptively simple question: What if the data we already have could become the design tool itself? Imagine conceiving a wall assembly, before you’ve even scoped the specification, you are presented with near instant insights showcasing low-carbon, code-compliant options ranked by cost and performance. In reality, designing a wall is a complex interplay among form, function, and cost. Throw sustainability objectives into the mix, and a supposedly “simple” design quickly becomes a tangle of trade-offs. Creating a novel wall assembly is even harder. Yes, architects already know that swapping steel for wood can trim embodied carbon, but assemblies are not single-material objects. Add fire-code constraints, moisture control, structural load paths, and supplier lead times. The resulting combinatorial explosion pushes most teams back to the same tried-and-tested (and often high-carbon) details. The time it takes to untangle all those dependencies is time practitioners rarely have. To achieve these goals, does the complex landscape of data management and design workflows require improved interoperability or is a fundamental rethink of how we design required? Creating a novel wall assembly is even harder. Yes, architects already know that swapping steel for wood can trim embodied carbon, but assemblies are not single-material objects. Add fire-code constraints, moisture control, structural load paths, and supplier lead times. The resulting combinatorial explosion pushes most teams back to the same tried-and-tested (and often high-carbon) details. The time it takes to untangle all those dependencies is time practitioners rarely have. To achieve these goals, does the complex landscape of data management and design workflows require improved interoperability or is a fundamental rethink of how we design required?
Now, imagine sketching a rough wall assembly. This could be with a pencil on the back of a sketchbook or on a tablet. This sketch can be consumed and, almost instantly, receive a live, curated shortlist of low-carbon insulation options, non-toxic sealants, or locally sourced claddings. Better yet, each recommendation could be accompanied by transparent data on cost, embodied carbon, fire safety, and thermal performance, so that a designer can ask immediate follow-up questions such as “Is this cladding fire-resistant?” or “Which regional species gives me the same look with lower maintenance?” That is precisely the experience our team has been working on. Under the hood, it isn’t a single, omniscient language model but a carefully choreographed partnership between vector-based similarity search (for breadth) and knowledge graphs (for rigor).
Sustainable design choices have the greatest impact when made as early as possible in the design process. Figure 2 showcases this carbon emission cost against the full life operational carbon of a building. Yet early-stage sketches and models typically lack the fidelity required for accurate environmental assessments. This catch-22 renders early decisions both difficult and error-prone due to the reduced amount of design detail. By harnessing a data-first, graph-centric framework, we aim to surface reliable material and assembly insights exactly when designers need them.
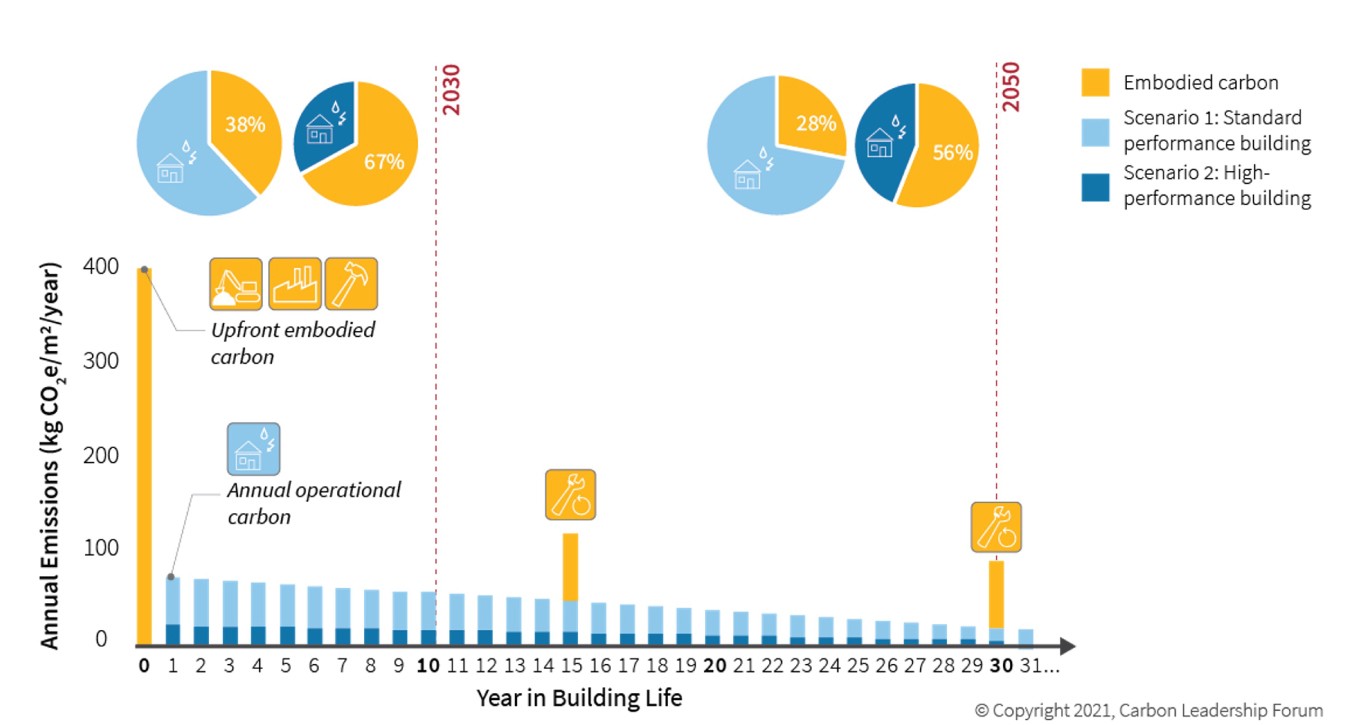
Figure 2 The bar chart underscores that, project-by-project, upfront material choices will soon dominate the climate footprint, highlighting the urgency of low-carbon construction design strategies.
Diving into the how
Wrangling the jargon
Before we plunge into the deeper technical discussion, it helps to pin down a few working definitions, starting simple and getting progressively more specific. Picture a large, labeled map where every landmark is a building product and every road is a relationship (e.g., “manufactured in,” “compatible with,” “has fire rating”). That roadmap is what software engineers call a knowledge graph: a living map of information that links concepts, entities, relationships, and events. At its core sits a schema (Figure 3), a formal description of the kinds of things that can appear in the graph and the relations that can join them. This schema acts as a blueprint that puts data in context and makes it easy to integrate and analyze information from separate datasets.
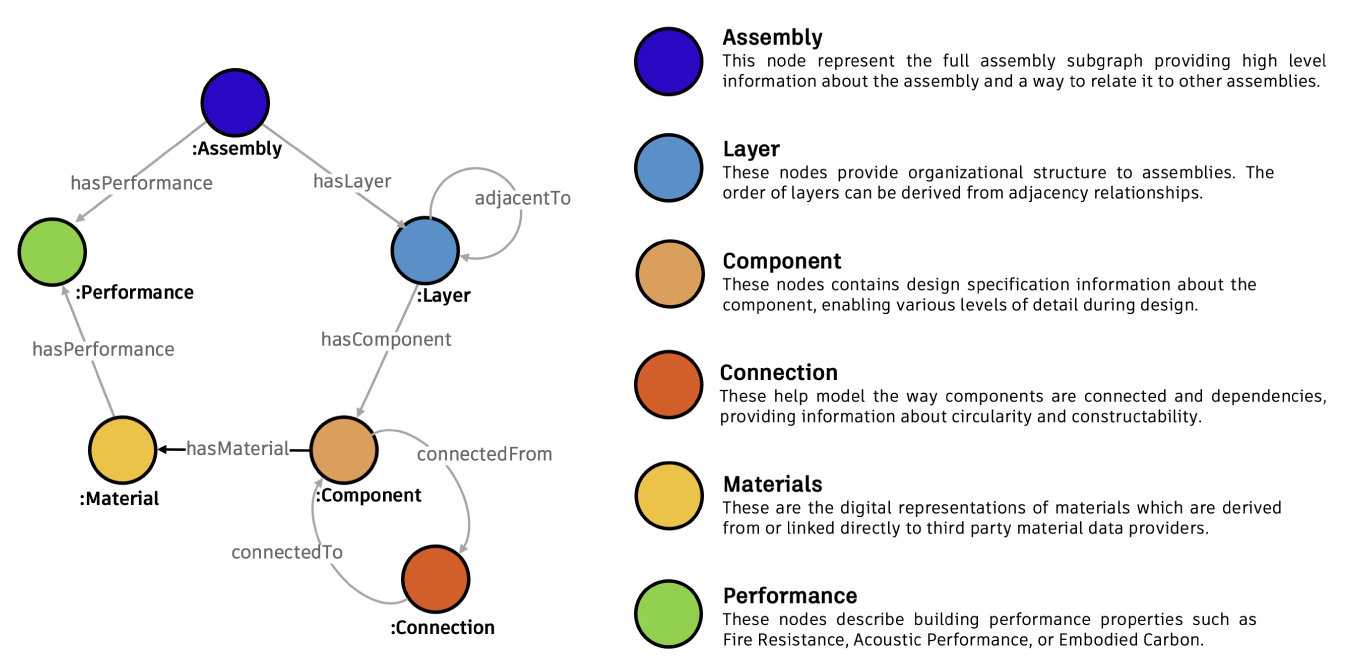
Figure 3 A schema is the formal ‘map’ that tells everyone (humans and software) what kinds of things can appear in a data set and how they fit together. By naming each class of node, listing its properties, and specifying the valid links and directions, the schema acts like a rulebook: it guarantees that every future wall-assembly record will be stored, queried, and shared in a consistent, machine-readable way.
An ontology builds on the schema by adding logical rules and inheritance, enabling software to reason over the graph and maintain consistency. You will also encounter vector-based embeddings, numerical representations that capture the salient features of text, images and other data and let algorithms measure similarity, form clusters or train machine learning models while linking back to the human readable concepts in the graph. This linking works much like our brains use past experiences to make sense of new situations. For example, we know that fire is hot and can burn us, so we instinctively approach it with caution in any context.
Why we need more than a large language model
This prototype is more than a demo; it’s a rehearsal for what the future workflows will need to support. By sharing it now, we aim to prepare the industry and lead the conversation on transparent, graph-centric AI. Large language models (LLMs) are remarkable at pattern-matching across vast text corpora, yet they falter when a designer needs verifiable product information, traceable to a manufacturer’s Environmental Product Declaration (EPD) or a specific code citation. Architects must be able to trust the numbers they see if those numbers will end up in a permit set or a client presentation. Rather than asking an LLM to “know everything,” our approach treats it as a conversational layer that taps into “live” external, well-structured data stored elsewhere.
Figure 4 Data exists in many formats, most of which exist outside of the design environment or are simply incompatible with the digital space without manual copying.
Vectors meet graphs
We embed concise, machine-readable summaries of every product in a high-dimensional vector index; this enables fuzzy, natural-language queries such as “stone wool insulation with R-value around 4, GWP under five, and decent acoustic absorption.” Vector search returns semantically similar items even when the query uses words that never appear in the product catalog.
The knowledge graph, on the other hand, stores the hard relationships—the fact that a specific insulation product is manufactured in Denmark, carries a Euroclass A1 fire rating, and is compatible with particular vapor barriers. We align the graph with existing ontologies such as the Building Product Ontology (BPO) and the Digital Construction Materials (DICM) ontology, so each node and edge can be shared or extended in other tools without translation headaches. This dual engine does more than answer a single design query. It demonstrates how an open, standards-aligned platform can let any Autodesk product (or third-party service) plug into the same live source of truth.
From raw documents to ready-for-design data
The pipeline begins with data collection: EPDs, specification sheets, BIM objects, cost databases, even supplier PDFs, see Figure 5. Natural language processing routines strip the noise, extract key attributes, and distill each product into a structured record concise enough to embed yet detailed enough to audit. Those records feed two destinations at once: the vector index for broad, fuzzy retrieval, and the ontology-driven graph for precise, logic-based reasoning.
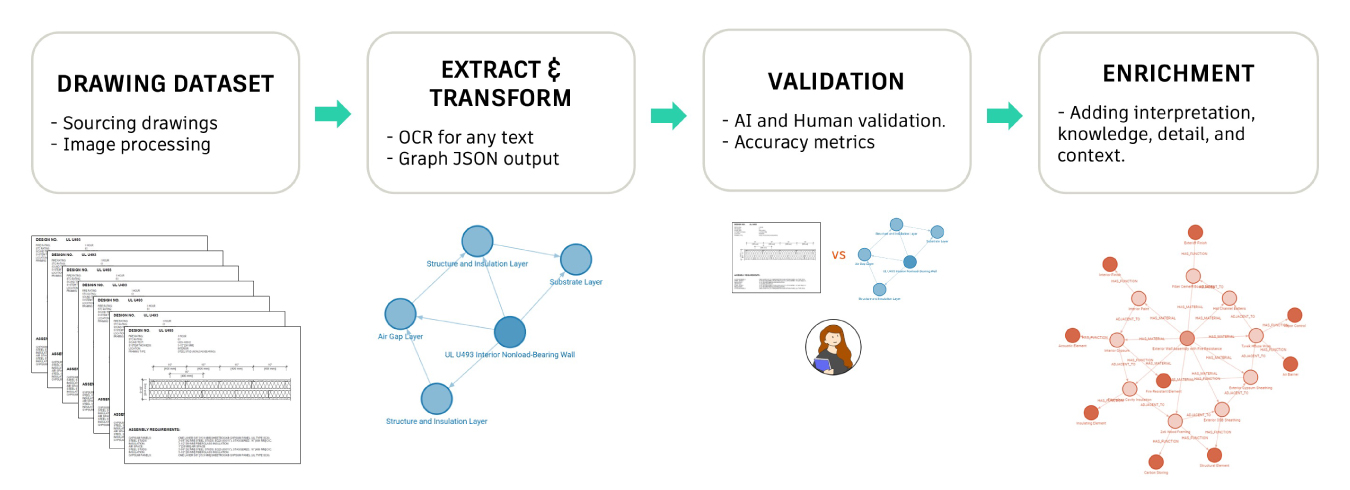
Figure 5 Pipeline from drawing to knowledge graph: gather and preprocess drawings → OCR-based extraction into graph form → AI + human validation → enrich with domain knowledge for detailed, contextualized data.
Representing a wall as a graph
A wall section drawing may look straightforward to the naked eye. Consisting of studs, insulation, sheathing, cladding, but computationally it is a highly connected network. Each layer affects thermal bridges, fire compartmentalization, structural load paths, and, by extension, the building’s carbon budget. By converting a drawing into a graph (see Figure 6) whose nodes correspond to layers, fasteners, finishes, and voids, we can run “what-if” scenarios quickly: What happens if we replace the gypsum board with a wood-fiber alternative that is five millimeters thicker and forty percent lower in embodied carbon? Because the wall assembly lives in the same graph as the product catalogue, the AI assistant can traverse relationships quickly and recompute global-warming potential, cost, or fire classification on the fly.
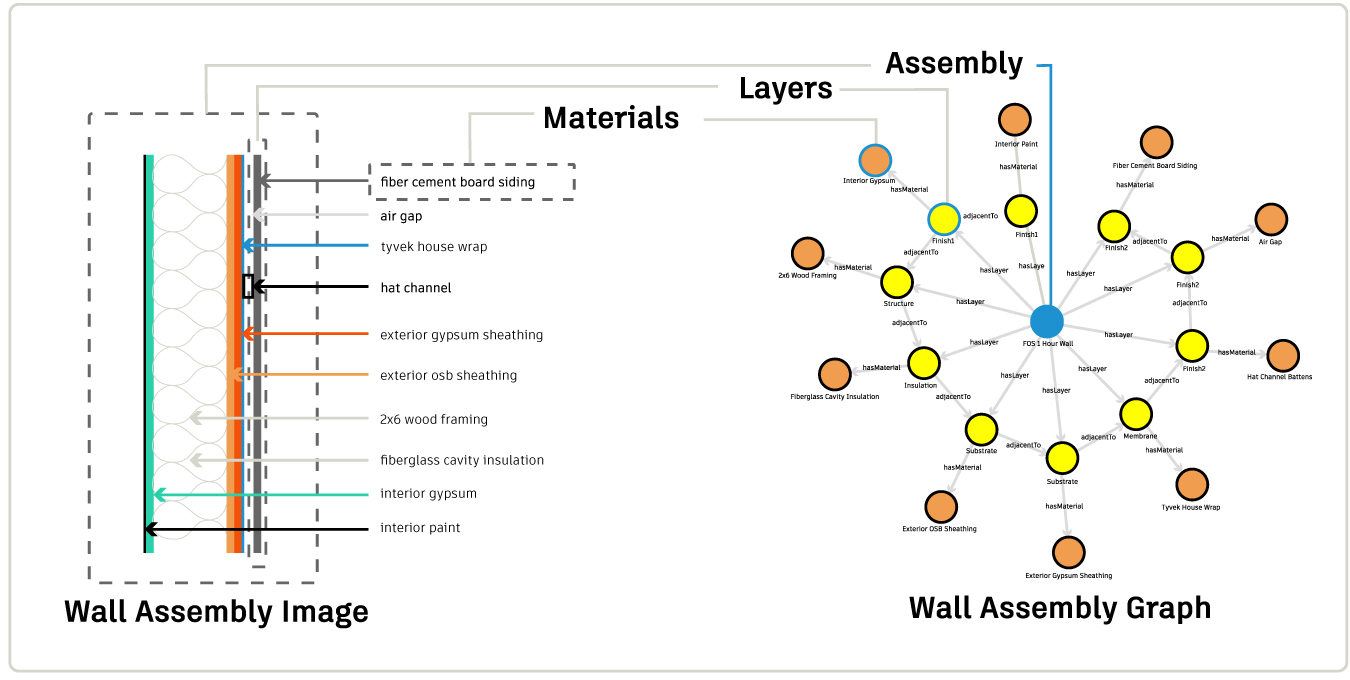
Figure 6 From drawing to data: a wall-section detail is decomposed into its layers and materials, then converted into a knowledge-graph where each layer node links back to its material and to adjacent layers. Turning a static assembly image into a queryable network of building information.
User Reception and Outlook
Inside the prototype
Our experimental interface reflects the workflow of real architects. A panel on the left accepts free-form user text prompts; “non-combustible, R-30, budget-constrained exterior wall for a mid-rise residential project in Ontario” but can also allow users to upload a sketch. The center of the screen keeps one foot in the familiar world of drafting and another in the new, showing a 2D detail, a spreadsheet-style spec table, and an interactive graph view that reveals layer relationships visually. On the right, performance metrics update in real time. Clicking on any component surfaces alternative products, complete with a short narrative explaining why they appear and how substituting them would change the assembly’s metrics. The process is deliberately transparent: every claim links back to a source document; every calculation can be inspected.
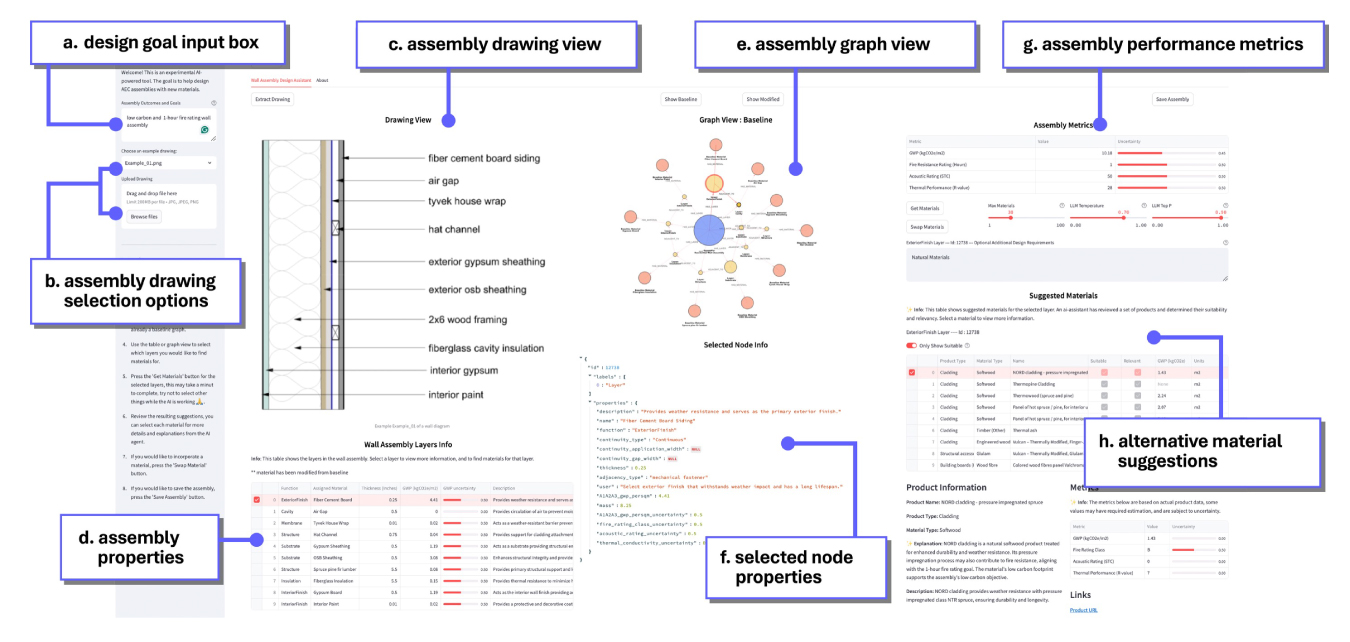
Figure 7 User interface of the graph-based design tool as demonstrated in the user workshops: (a) the architect specifies the design intent; (b) a wall-assembly drawing is selected or uploaded; (c) the assembly view lists the individual layers; (d) selecting a layer reveals its material properties; (e) the graph view visualizes relationships between assembly components; (f) node-specific attributes (e.g., global-warming potential and fire rating) are displayed on demand; (g) aggregated performance metrics are calculated for the complete assembly; and (h) the system proposes alternative materials that satisfy the stated intent.
What practitioners told us
To test the concept we ran 11 in-depth workshops with professional architects recruited through the Autodesk Research Community, and published our findings in DIS. Participants first described their habitual workflow for early-stage material selection, then tackled the same design brief with the prototype. Unsurprisingly, they characterized the conventional process as a cumbersome juggle of PDFs, spreadsheets, and instinct. By contrast, the prototype, presented in Figure 7, narrowed viable choices within seconds and provided the data to justify them, which participants said reduced mental effort and bolstered confidence. Designers were initially puzzled by the graph view, but most warmed to it after realizing it exposed dependencies. For example, how a change to the exterior sheathing ripples through fire rating and moisture management, which remain invisible in static drawings. Crucially, the presence of explicit data sources and step-by-step rationales increased their trust in the AI’s recommendations. The candid feedback from these architects helps us de-risk the concept before it scales, exactly as our Mission demands.
Where we go next
Looking ahead, our roadmap focuses on three intertwined goals: deeper ontological alignment, an adaptive interface that can dynamically hide or reveal complexity to match each user’s needs, and a gradual expansion of scope beyond wall assemblies to include roofs, façades, and ultimately mechanical systems. One of the greatest challenges on the road to a truly sustainable built environment is the creative reuse of existing materials. Because reclaimed components often arrive in unique, unpredictable states, integrating them into fresh designs remains an uphill struggle. By adopting this data-first framework, however, we aim not only to simplify the incorporation of these irregular materials but also to generate actionable suggestions for how they might be augmented or adapted, so they continue to perform effectively for years to come.
A new framework for design decisions
Large language models may capture public imagination but in professional design practice they only shine when anchored to transparent structured and traceable data. Knowledge graphs provide that anchor while vector search supplies agility and together they create a common fabric where every strand of multimodal information such as text BIM geometry point clouds sensor streams product data sheets and photographs can finally coexist and be queried as one, imagined in Figure 8 below.
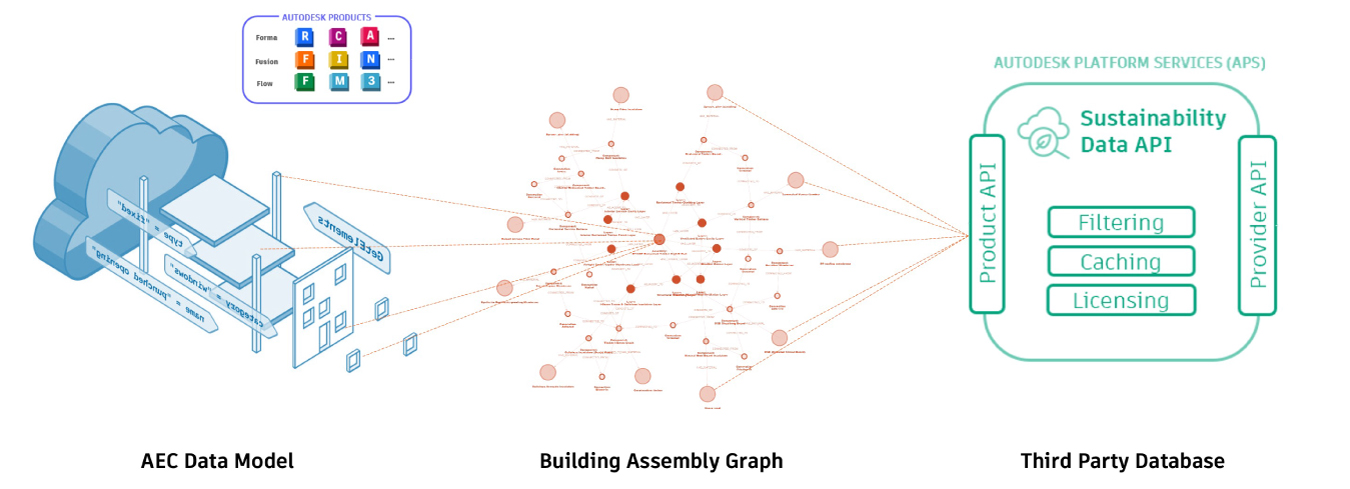
Figure 8 By letting data behave as a design tool, the work advances Executive Vice President and Chief Technology Officer Raji Arasu’s vision for an open and flexible Autodesk Platform that delivers insight exactly when it is needed.
By mapping this data to shared, machine-readable ontologies, the framework also tackles one of the industry’s oldest challenges: agreeing on what things are called and how they relate. When terms such as “door entrance leaf” and “Assembly 08 11 13” resolve to the same graph node, AI can reason across models and disciplines without getting lost in translation, allowing us to move away from brittle expert systems.
The opportunity is bigger than tidy data alone. A graph-backed platform becomes the launch pad for the next generation of Model Context Protocol (MCP) services, which bundle geometry, metadata, performance goals, and provenance into a single shareable context. Within this environment, AI could continuously validate code compliance, evaluate carbon targets, and surface circular-economy options the moment a line is drawn. In other words, the future of sustainable building may begin with a simple sketch—but it will be delivered by a graph that is ready for every model and every mandate that follows.
Get in touch
Have we piqued your interest? Get in touch if you’d like to learn more about Autodesk Research, our projects, people, and potential collaboration opportunities
Contact us