From Principles to Application: Causal Inference Using a Public Software Defect Dataset (Part 2)
This is the second blog in a two-part series to explore the significance of causality for Responsible AI. From Prediction to Prescription: Why Causality Matters for Responsible AI (Part 1) covered the theoretical framework, and this part will provide an example causal inference pipeline, implemented using data from a publicly available dataset.
Dataset Features and Feature Grouping
The NASA CM1 software defect dataset was chosen for this case study because it provides a well-structured and publicly available dataset for studying causes of software defects. CM1 reflects operational spacecraft software, where reliability and accountability are critical. It serves as a proxy for broader engineering systems where multiple interacting factors influence reliability and performance. We begin by first defining the raw features available in the dataset for preprocessing.
Feature Description
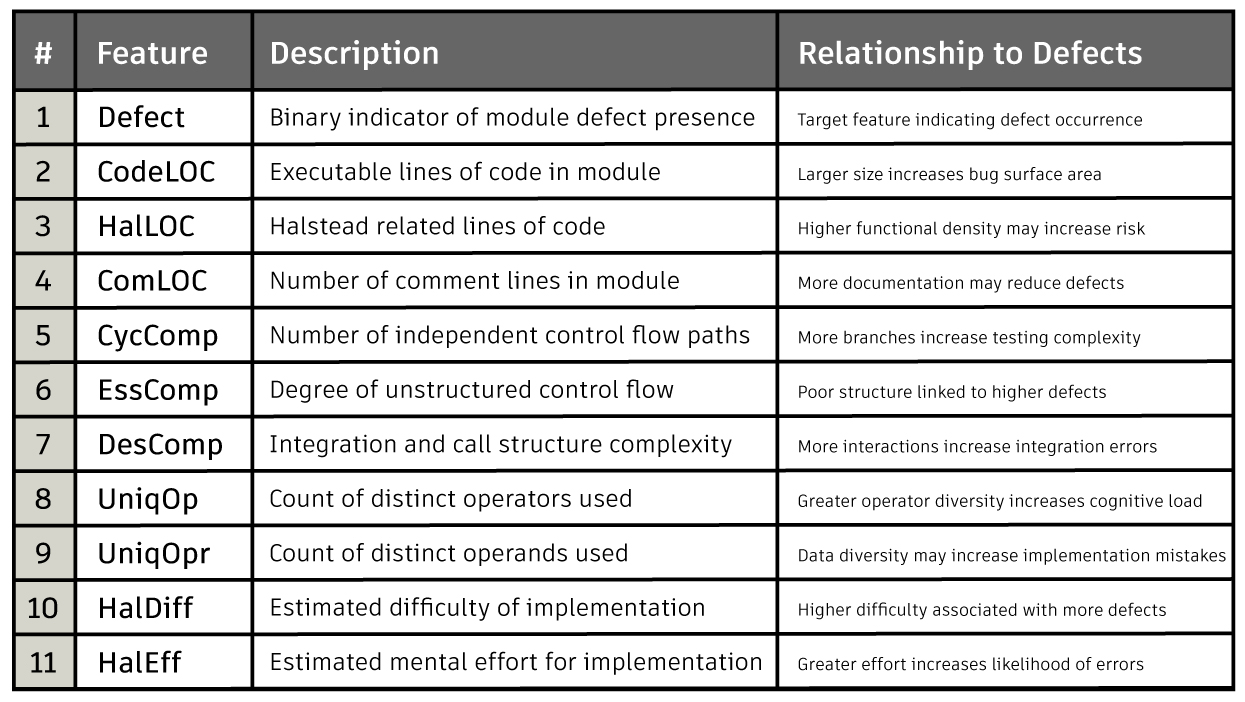
The defect rate is 9.84% out of 498 records. To simplify the analysis and reduce multicollinearity among highly correlated metrics, related software measures were grouped into composite features. The target feature, Defect, was converted to a binary indicator with values 0 or 1. Size-related measures such as executable lines, Halstead lines, and comment lines were averaged to create a unified Size feature. Structural control flow metrics, including cyclomatic, essential, and design complexity, were combined into a McCabe composite representing branching and integration complexity. Halstead metrics were similarly grouped into HalStruct for structural diversity and HalCog for cognitive effort, providing higher-level representations of code complexity.
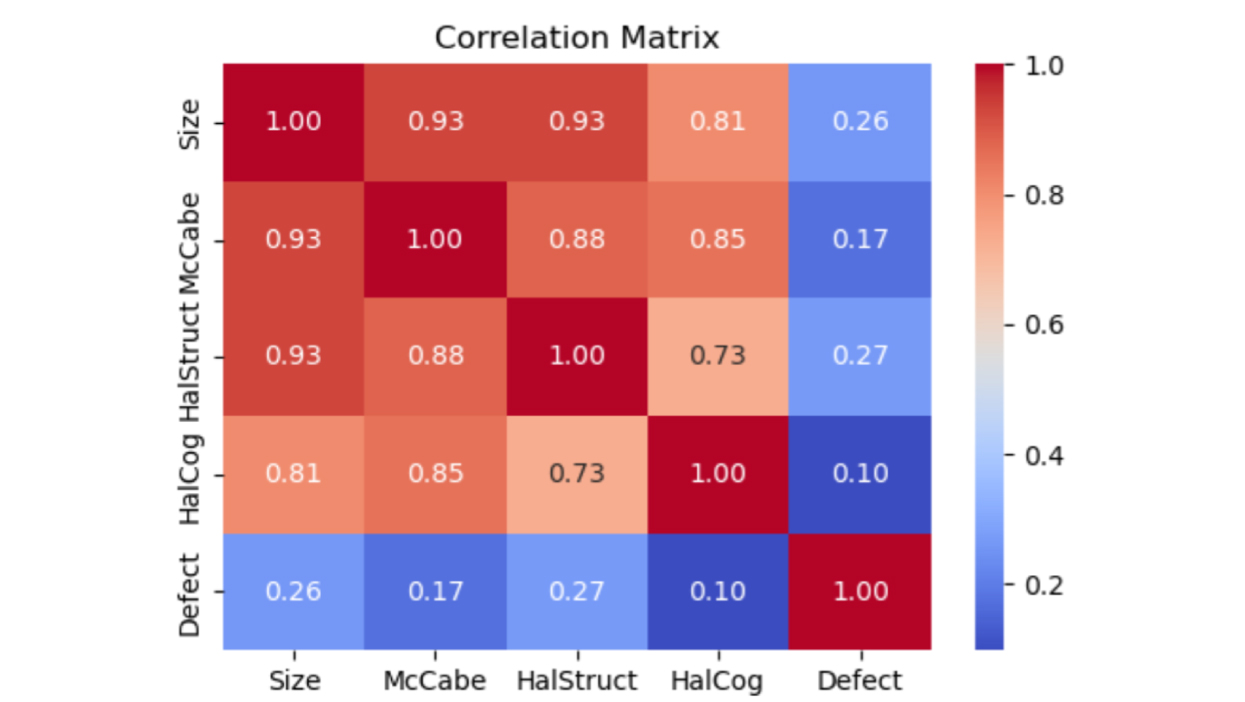
Fig. 1 Correlation matrix shows that other features are not highly correlated with the Defect target feature. However, Size is highly correlated with McCabe and HalStruct.
Causal Discovery and Causal Graphs
Causal discovery was performed using the NOTEARS algorithm on all continuous features except the binary target feature. Prior to training, predictors were standardized to ensure stable optimization and comparable scale across features. NOTEARS learns a directed acyclic graph by optimizing a continuous objective function subject to an acyclicity constraint, allowing the causal structure to be estimated directly from data. Domain knowledge was incorporated through a prior knowledge matrix that enforced that Size could influence McCabe cyclomatic complexity while forbidding the reverse direction. After learning the predictor level structure, logistic regression was applied separately to estimate the relationship between the predictors and the binary Defect outcome.
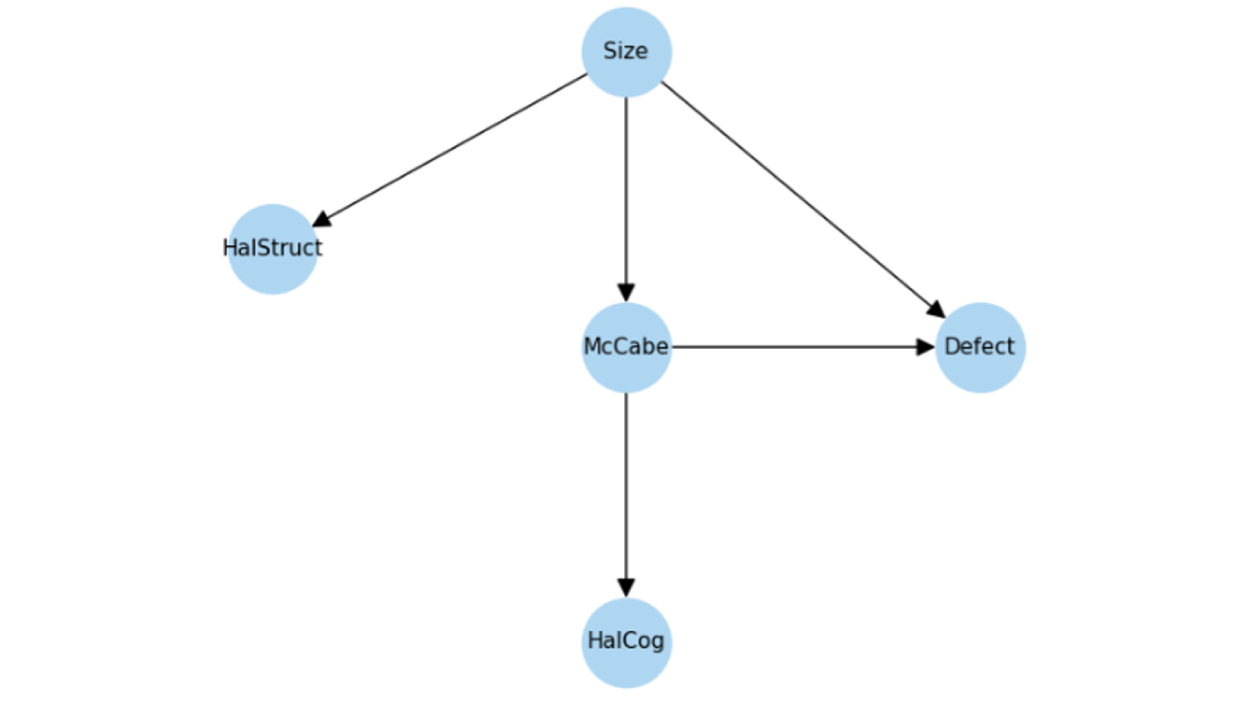
Fig. 2 Causal graph after causal discovery. Size acts as a common cause of both McCabe and Defect, making it a confounder when estimating the effect of McCabe on Defect.
Estimate and Refutation
To estimate the causal effect of Size on Defect occurrence, Size was first standardized and used as the treatment feature in a DoWhy causal model. Because Size is modeled as an upstream driver in the causal graph, and no features act as common causes of both Size and Defect, no additional confounders are required for this estimation. McCabe is treated as a mediator on the causal pathway rather than a confounder, so adjusting its effects would block part of the total causal effect of Size. The effect was estimated through a generalized linear model with a binomial family, equivalent to logistic regression for a binary outcome. The estimate step quantifies how one standard deviation increase in Size changes the log odds of observing a Defect. The mean estimate is 0.055, which translates to an increase of 0.50% in the probability of a defect.
The refutation step then evaluates the robustness of this estimate. The random common cause refuter introduces an unrelated synthetic feature to test whether the estimate is sensitive to irrelevant covariates; a large p-value suggests stability. In contrast, the placebo treatment refuter permutes the treatment feature, deliberately breaking any real relationship between Size and Defect. If the estimated effect collapses under permutation, this indicates that the original estimate was capturing a genuine signal rather than random noise.
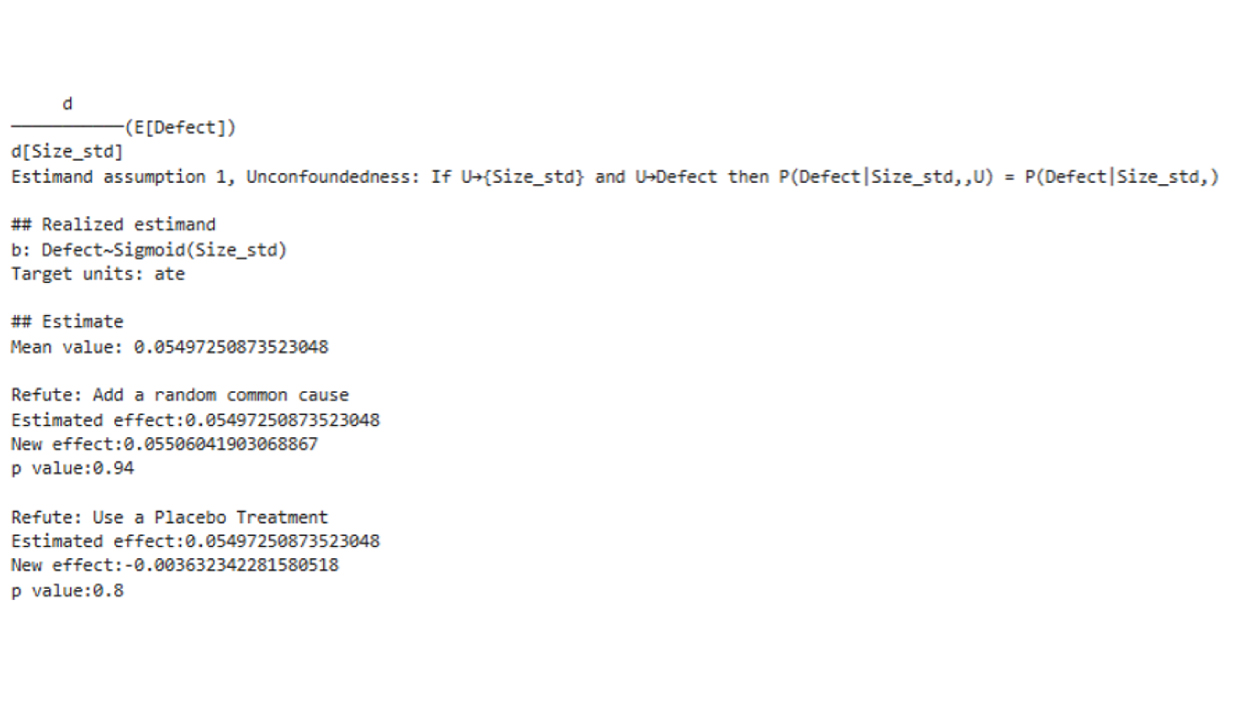
Fig. 3 The p-values obtained from both refutation methods (random common cause and placebo treatment) are high. Therefore, we fail to reject the null hypothesis that the original estimate is equal to the refuted estimate, suggesting that the causal estimate is robust to these refutation tests.
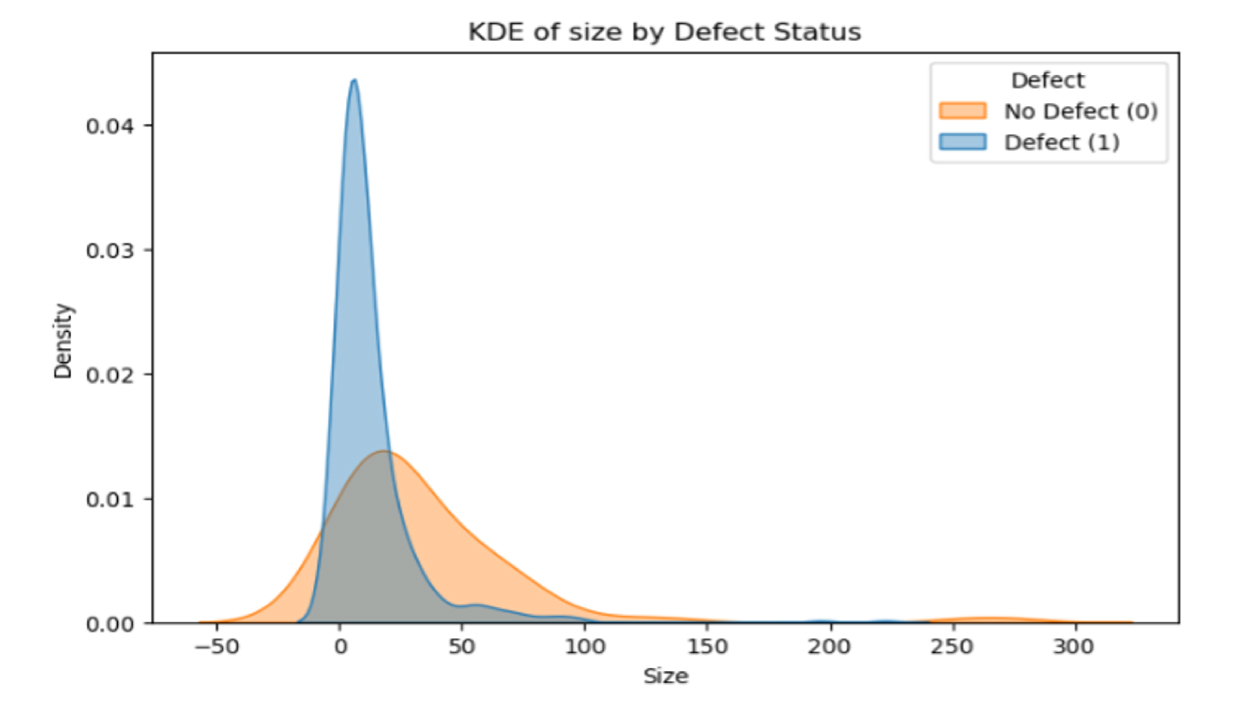
Fig. 4 The kernel density estimate (KDE) for Size shows a substantial overlap between defective and non-defective modules, particularly around the peak region. This indicates that while Size influences defect probability, it does not strongly separate the two classes.
Intrinsic Causal Influence
Intrinsic Causal Influence (ICI) quantifies how much variability in the target node is driven by causal features. In the causal graph, Size influences McCabe, and both feed into Defect. The ICI decomposition shows that 15% of the variance in Defect is attributable to Size, 5% to McCabe, and the remaining 80% to Defect itself. The correlation matrix and KDE plot support this, as Defect is not highly correlated with any other feature. This also aligns with the causal graph. Once Size explains most of the structural variation, McCabe contributes little independent variability to Defect.
ICI relies on Shapley value-based contributions. However, when features are highly multicollinear, as in the case of Size and McCabe, Shapley attribution can struggle to cleanly separate their effects because both features explain nearly the same variation. In such settings, ICI may divide influence based on model behavior rather than true independent causal contribution, reflecting limitations in identifiability.
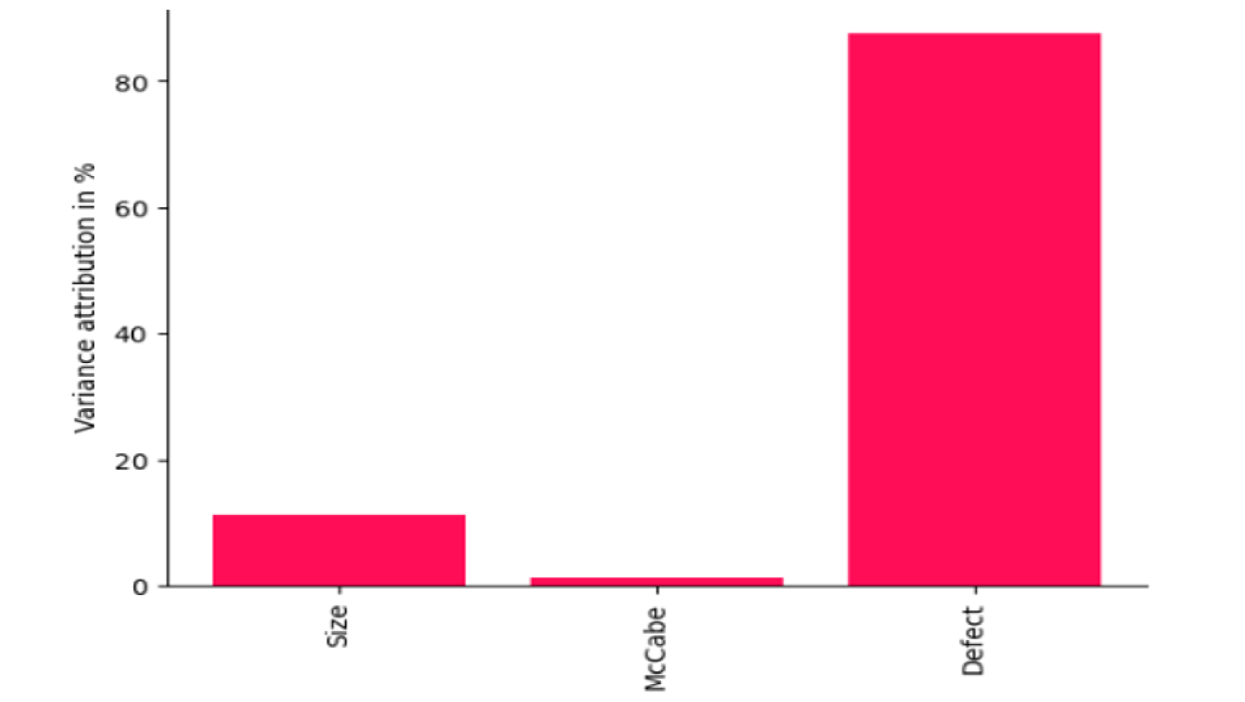
Fig. 5 Intrinsic causal influence for Defect target feature. 80% of the variance is explained by Defect standalone variance and 15% by Size.
Conclusion
This case study demonstrates how causal inference complements traditional predictive analysis. While size-related metrics show measurable causal influence on software defects, most variation remains unexplained, reflecting the complex and socio-technical nature of software quality. Causal discovery, confounder identification, effect estimation, refutation, and intrinsic causal influence together provide a structured framework for causal analysis. This enables more reliable, interpretable, and accountable AI-driven decision making, reinforcing the principles introduced in Part 1.
Get in touch
Have we piqued your interest? Get in touch if you’d like to learn more about Autodesk Research, our projects, people, and potential collaboration opportunities
Contact us